


|
The Computer Engineering group of DI mainly conducts research in the following areas:
Algorithm Engineering and Graph Algorithms. The group investigates the design of efficient algorithms and data structures, with particular emphasis on geometric and graph algorithms. Key research topics include graph drawing and computational geometry. Within these areas, the group has developed several software libraries and systems, often in collaboration with institutional and industrial partners such as Agenzia delle Entrate, Roma Tre University, TU Wien, University of Passau, and KPMG. This expertise in algorithm design has played a key role in several national and European research projects.
Information Visualization and Human-Centered Computing. The group develops tools that enable policymakers, scientists, analysts, and decision-makers to visually explore large-scale data and integrate analytical insights with domain knowledge. These tools primarily target networked datasets, which are central to many application domains. In 2009, the group founded an academic spin-off to facilitate the research transfer into real-world applications. The group enjoys strong international visibility in these fields, participating in steering committees of major international conferences and serving in editorial roles for leading scientific journals.
Software Engineering and Artificial Intelligence. The group conducts research on the design, analysis, evaluation, and deployment of software systems integrating machine learning, large language models, and data-driven decision-support methods. Its activities focus on trustworthy, explainable, and human-centered AI, agentic AI architectures, and advanced software solutions for domains such as education, industry, and public services. The research also addresses scalable methods for processing complex data and translating advanced AI techniques into practical, high-impact applications. In these areas, the group has established collaborations with industrial partners such as Rete Ferroviaria Italiana and Sharp Corporation.
Cybersecurity and Blockchain. The group's research also focuses on cybersecurity, distributed infrastructures, and blockchain technologies. In particular, it investigates blockchain-based solutions for trusted data sharing, as well as methodologies for testing smart contracts in decentralized applications (DApps).
|
|
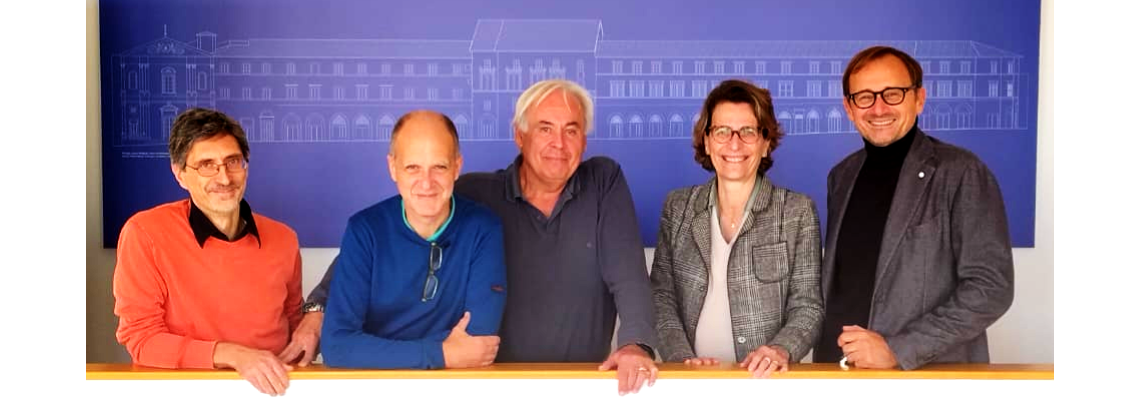
Componenti
|
Sistemi di elaborazione delle informazioni - ING-INF/05
- Dettagli
- Scritto da Francesca Tufi